
The first quarter
they could see themselves.
Indonesian restaurant. South Melbourne. Family-run, fully-booked weekends, twenty years of word of mouth. What they didn’t have was a way to see any of it on a screen. We built one.
Q1 2026 · Jan – Mar · all data sourced from PNB’s own warehouse
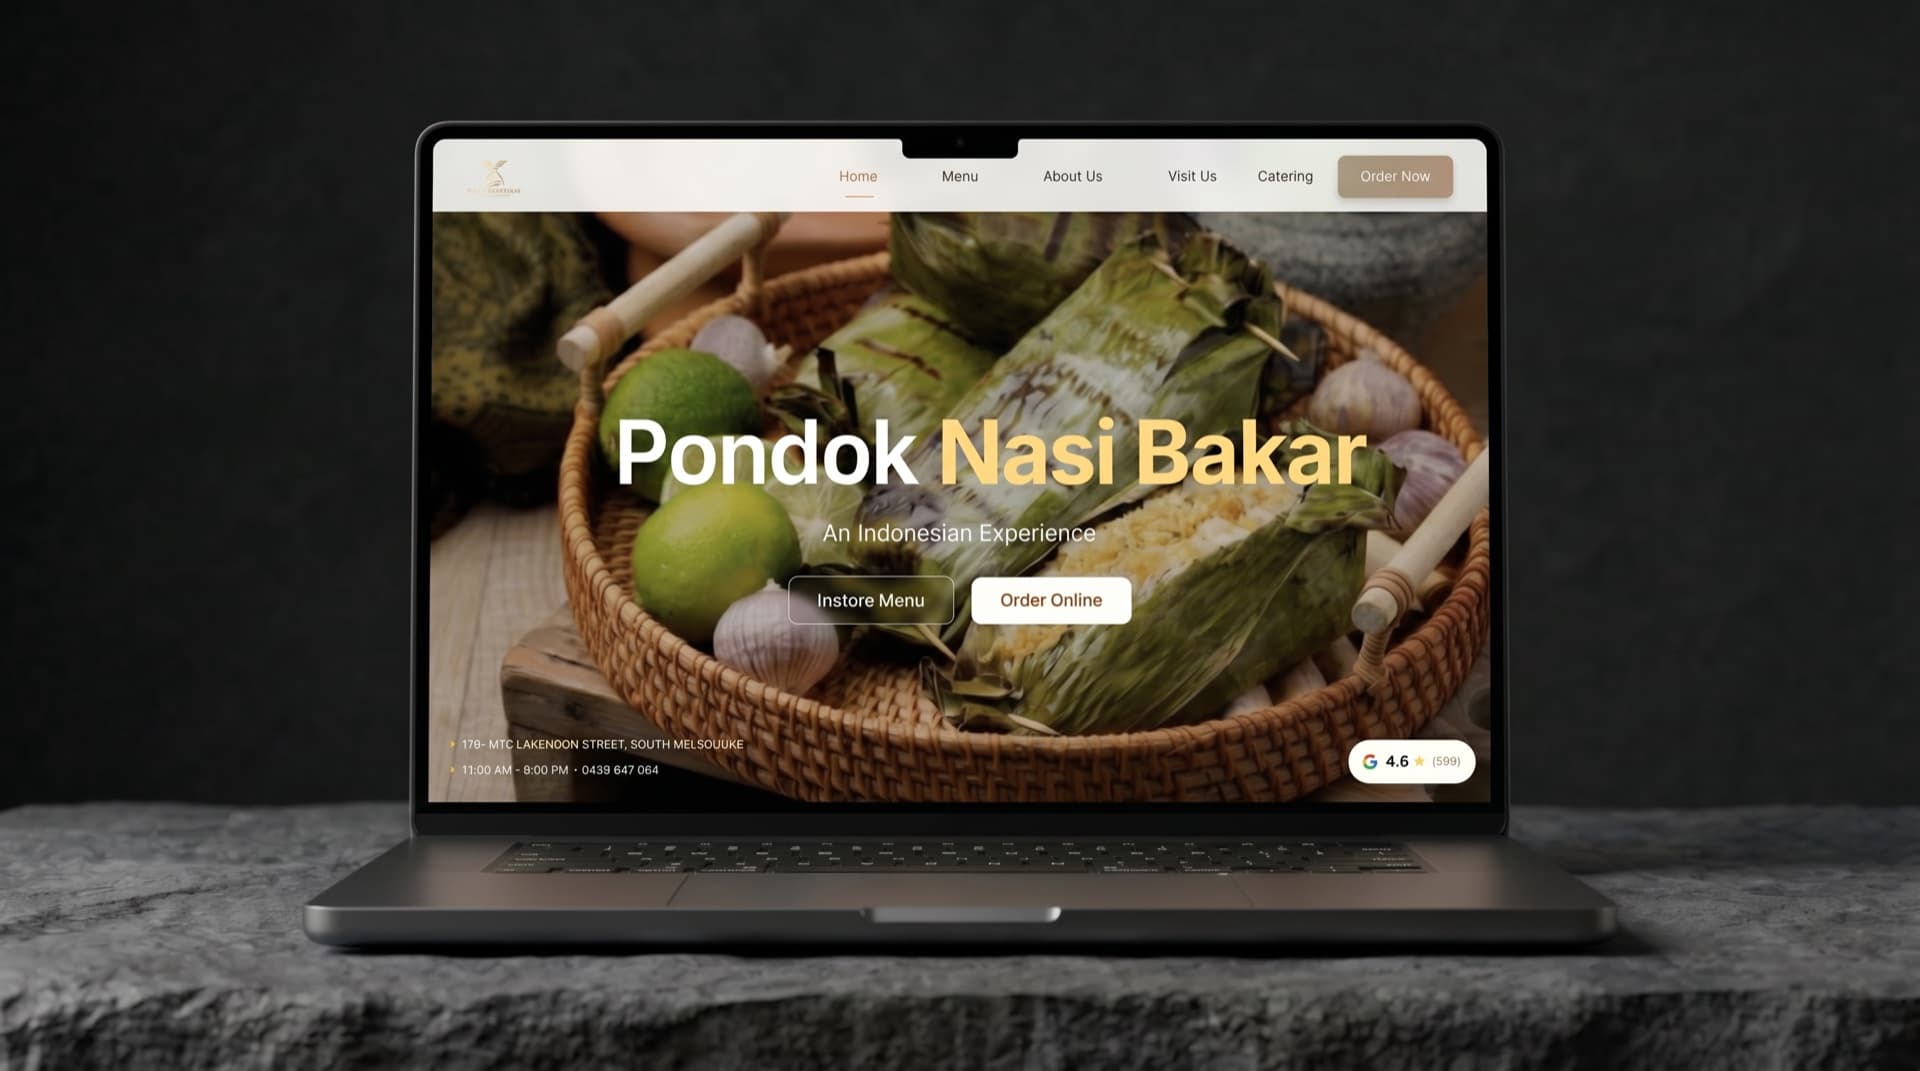
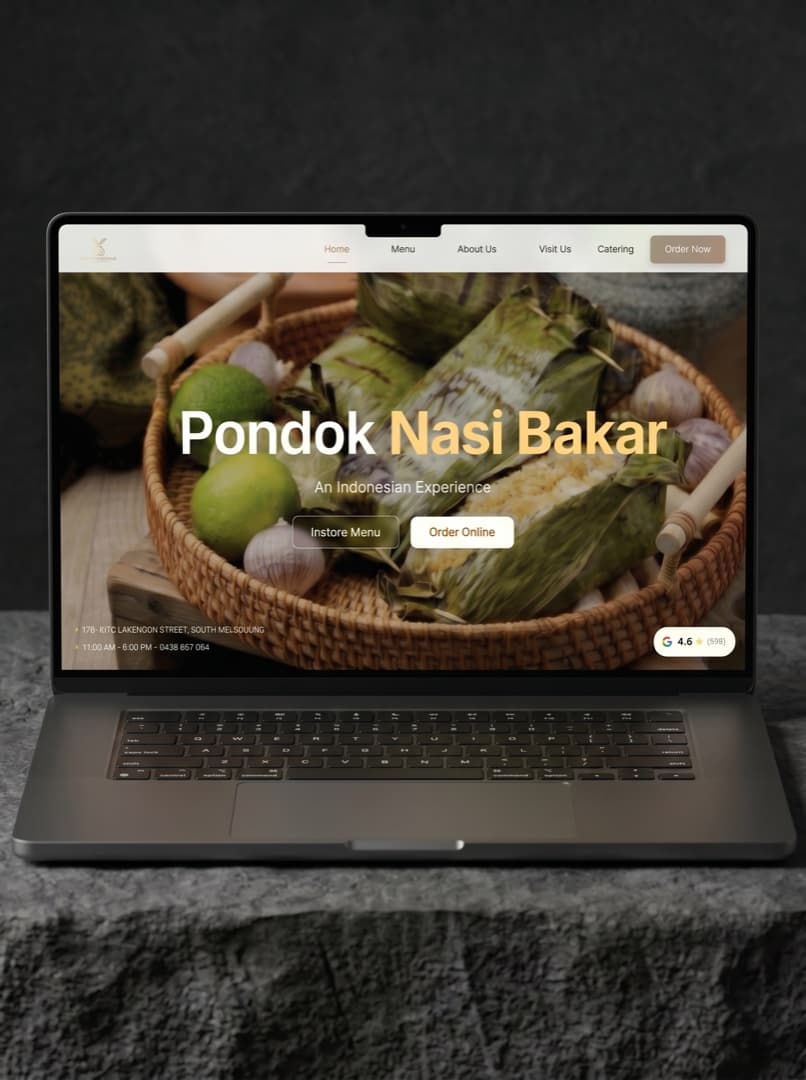
Most restaurants run on guesswork. PNB doesn’t anymore.
Before this quarter, PNB had a reputation, a packed dining room, and no visibility into anything between the screen and the door. Who found them on Google. What they searched. Who tapped “directions”. Who called. Who left a five-star review last week. None of it lived anywhere they could see.
We built the infrastructure that surfaces every one of those signals into a database PNB owns. This is the first quarter of what they can now see.
145,849 people saw PNB on Google this quarter.
Google Maps and Google Search are the front door for a restaurant. Before, those numbers lived inside Google’s dashboard, unread. Now they land in PNB’s warehouse the first of every month.
GBP impressions
Jan 43,451 · Feb 48,696 · Mar 53,702 — climbing month over month
Direction requests
Tapped “Directions” — direct visit-intent signal
Phone calls
Tapped “Call” straight from the listing
Menu views on GBP
Browsed the menu before deciding to come in
When someone in Melbourne searches south melbourne indonesian food, PNB is the first or second result.
The non-branded queries are the ones that matter. Branded searches — “pondok nasi bakar” — find people who already know about you. Discovery searches — “indonesian restaurant south melbourne”, “nasi bakar south melbourne” — find people who don’t. PNB now ranks top-two for the discovery terms, every month, in front of every competitor in the suburb.
- Impressions37,422
- Clicks1,183
- Avg. CTR3.16%
- Avg. position11.77 → 10.26climbing toward page 1
- · nasi bakar south melbourne
- · indonesian restaurant south melbourne
- · south melbourne indonesian food
+69 new five-star reviews in 90 days.
Reviews compound. The hundredth review is worth more than the first. PNB went from 524 to 593 in a single quarter, holding 4.60 stars steady — every new diner that searched the restaurant in March saw a more trustworthy listing than the one in January.
Average rating across 593 Google reviews · end of Q1
- Reviews · Jan524
- Reviews · Feb558
- Reviews · Mar593
- Net new this quarter+69
From phone tag to a qualified database.
Catering inquiries used to come through Instagram DMs, phone calls, and a contact email nobody checked. We built a structured form — guest count, event type, date, location, brief — that writes every submission to PNB’s own database, fires a notification to the team, and confirms back to the guest. In March alone it generated 11 inquiries — up from 4 in January.
- Form views · Jan / Feb / Mar21 · 26 · 71
- Form starts20 · 18 · 50
- Form submissions4 · 6 · 11
- · +238% form views Mar vs Jan
- · +175% submissions Mar vs Jan
- · 21 qualified leads in Q1, every one captured to a row PNB owns
People stayed longer. And ordered bigger.
The site behaviour metrics PNB couldn’t see before now show healthy, improving trends. Bounce rate dropped seven points, the average session stretched out, and online order value moved up the ladder.
47.6% → 40.6%
Down 7 points across the quarter
52.4% → 59.4%
Up 7 points — visitors going deeper
2:16 → 2:34
Eighteen seconds longer per visit
$8,966
Q1 total · +22% Mar vs Jan
$45.74 → $53.16
People are filling bigger carts
116 → 258
+122% intent on the “order online” button
Four systems. One database underneath them all.
Every number above traces back to one of these four systems. They run independently, they talk to one shared warehouse, and PNB owns every line of code and every row of data.
- 01
A custom website they own
Built from scratch in Next.js — fast, mobile-first, on their own domain. No template subscriptions, no platform lock-in. The codebase is theirs to keep.
- 02
Online ordering, native to the site
Square integrated into the menu. People order direct, payment processes at checkout, no third-party delivery skim on takeaway. Eight thousand dollars and growing in the first quarter.
- 03
A catering inquiry pipeline
A structured form on the site, every submission written to PNB’s own database with email notification to the team and a confirmation back to the guest. Twenty-one qualified inquiries in Q1.
- 04
A unified data warehouse
GA4, Search Console, Square, Abacus POS, and Google Business Profile all flow into one Supabase project — owned by PNB. Monthly insight reports auto-generate on the first of every month.
Every number above writes to a database PNB owns.
Their website, their catering pipeline, their warehouse, their customer data — all of it lives on infrastructure they control, with keys they hold. That’s not a perk; it’s the foundation. Q1 isn’t a snapshot. It’s the first chapter — every month from here adds another set of rows to a story they get to keep.